The Daily Tar Heel
Printing news. Raising hell. Since 1893.
Thursday, April 25, 2024 Newsletters Latest print issue

We keep you informed.

Help us keep going. Donate Today.
The Daily Tar Heel

Oxford statisician presents research on spread of COVID-19 to UNC students

0154451F67D24A2384CF058FBD41D3D0.png

Professor and statistical epidemiology specialist Christl Donnelly detailed her experiences tracking COVID-19 to students enrolled in the Carolina Away program and the public on Monday, Sept. 14, 2020 over Zoom. Donnelly is the deputy head of the department of statistics at Oxford University and a specialist in statistical epidemiology at Imperial College London. 

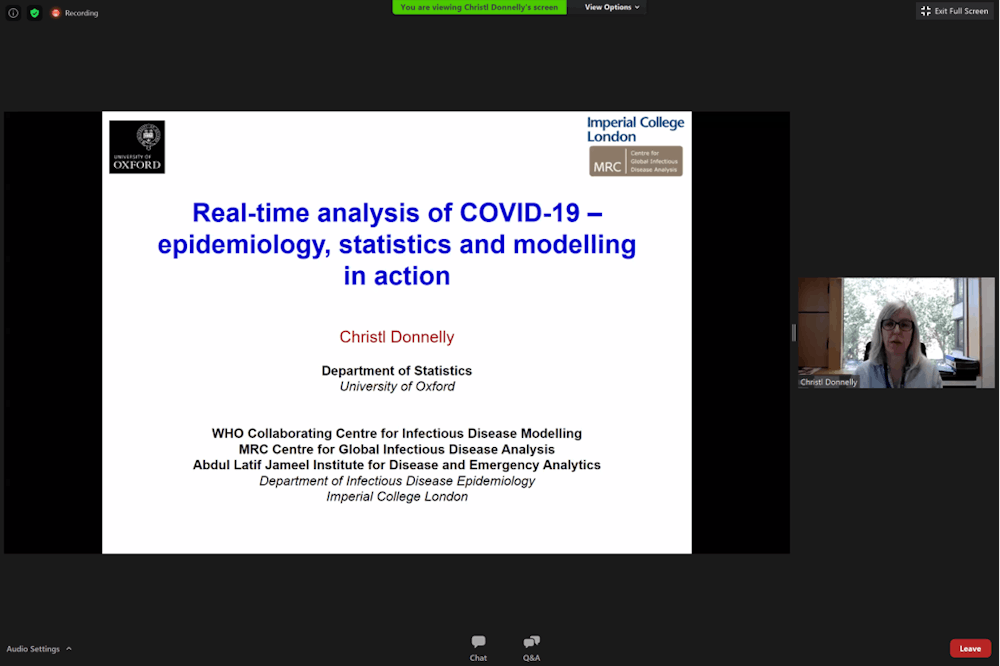
Professor and statistical epidemiology specialist Christl Donnelly presented her experience tracking COVID-19 to students enrolled in the Carolina Away program and the public on Monday — all the way from Oxford. 

Donnelly is the deputy head of the department of statistics at Oxford University and a specialist in statistical epidemiology at Imperial College London. The presentation was part of the “Data Science for COVID-19” course, designed by Richard Smith, a professor in the UNC Department of Biostatistics. Smith said the course is part of the Carolina Away COVID Investigations and Learning Community. 

Donnelly was introduced by Chancellor Kevin Guskiewicz, who cited UNC's ranking as the top university in the United States in terms of the impact of COVID-19 research. 

Donnelly is part of the Imperial College MRC Centre for Global Infectious Disease Analysis, as well as the World Health Organization Collaborating Centre for Infectious Disease Modelling. 

As part of these groups, she has provided informed estimates of the total number of cases in the world, calculated COVID-19’s reproduction number — the average number of people infected by one case of the virus — and helped modify simple mortality rate calculations to be more accurate.

Calculating total number of cases

In January, Donnelly said she and her team set out to estimate how many cases of COVID-19 there were in the world.

“Only a couple of dozen cases had been identified in China,” Donnelly said. “And yet, we were seeing cases being detected outside of China in travelers.”

She said the team used a variety of factors in its calculations, such as the number of cases outside of China, the probability that a case would be detected outside of China, the incubation period of the virus, the average time of case detection and the daily probability of international travel, using the number of daily passengers leaving Wuhan Tianhe International Airport.

“This was when the epidemic was very much focused in Wuhan,” Donnelly said.

Using this method, Donnelly said she and her team were able to take the three cases that had been confirmed outside of China as of Jan. 17 to predict that there were likely about 1,700 cases of COVID-19 worldwide. Later, on Jan. 22, the group used the same method to predict that the number of cases had grown to about 4,000. 

“Now, with two different estimates, using the same sort of methods, we could then estimate what the growth rate was with this epidemic,” Donnelly said. 

Calculating the reproduction number of COVID-19

After Jan. 22, with the two samples and predictions they had made, Donnelly said she and her team went on to calculate their best estimate for the virus’s reproduction number.

“If you’ve been watching the news, you’re probably familiar with people talking about R, the reproduction number of the disease,” said Donnelly. “That’s the average number of new infections that one infection causes.”

Using the two data points at its disposal, the team estimated the reproduction number in China to be around two, “with uncertainty between about two and a half to three and a half.”

“This suggests that this epidemic — unless something changes — this outbreak will continue to grow, and you would expect it to grow exponentially,” Donnelly said.

Mortality rate calculations

Donnelly said that during the SARS outbreak of 2003, the WHO published daily reports of the virus’s fatality rate by dividing the number of deaths by the number of cases.

“If you do this in the middle of an epidemic, you don’t have the total number of cases and the total number of deaths — you have the number of cases so far and the number of deaths so far,” Donnelly said. 

Donnelly said that because it takes a number of weeks to die from SARS, the recorded number of deaths would lag behind the actual number. 

To get the day's news and headlines in your inbox each morning, sign up for our email newsletters.

In response to this, Donnelly said she and her team proposed an alternative formula: divide the number of deaths by the number of deaths and recoveries. This way, the calculation would only consider those for whom the virus had run its course, and the result would be more accurate.

“It’s complicated further when we think about COVID-19, because a substantial number of the infections don’t actually become symptomatic,” Donnelly said.

She said the variance in numbers of cases detected can lead to different results when trying to predict the fatality rate of COVID-19.

Donnelly ended the presentation by analyzing the history of North Carolina’s COVID-19 reproduction number. 

She presented a graphic, demonstrating that early in the year, for every case, three people would become infected. But through a series of what she called “interventions,” the number dropped to around one infection per case. 

Statistics, rather than predict what will happen, show what could occur if nothing changes, Donnelly said. 

“The models show, ‘If we don’t change our behavior, what happens?’” Donnelly said.

university@dailytarheel.com