However, multiple-choice assessments alone don’t give students the opportunity to demonstrate the extent of their knowledge, Trice said.
“If I had my way, we could look at other ways that students can demonstrate mastery in the classroom,” he said.
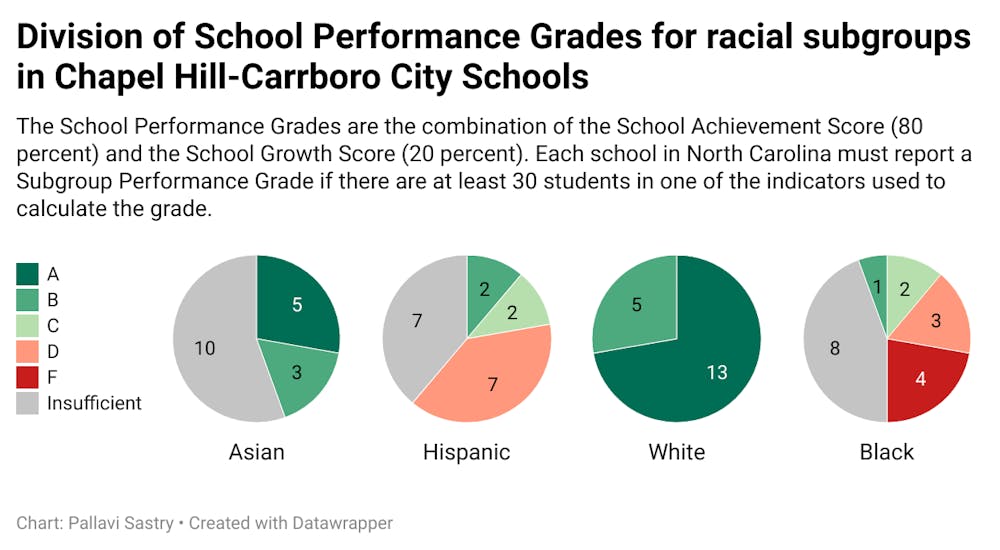
Performance grade disparities
The NCDPI's data indicated disparities between socioeconomic subgroup performance grades within schools.
Eighteen schools in CHCCS — all except UNC Hospital School and Phoenix Academy High School— had subgroup letter grades recorded in data from NCDPI.
Every single one of those schools received a grade of "A" or "B" in the subgroup of students who are categorized as white.
In contrast, there wasn’t a single school in CHCCS that awarded the Black student subgroup with an “A”.
Furthermore, nine out of 11 schools with sufficient data from the Hispanic student subgroup received a letter grade of "C" or lower.
Sixteen of the 18 schools in the district received a letter grade of "D" or lower or were indicated as having insufficient data for students who were categorized as English learners or as being economically disadvantaged.
The federal Every Student Succeeds Act of 2015 specifies 30 as the minimum number of students per indicator subgroup.
Sartain said she believes this is related to students' access to resources outside of school and said the system is set up to punish schools that serve disadvantaged student groups.
An "Insufficient" grade is only given if there is not enough data for all the indicators of the subgroup. If a subgroup meets the minimum requirement for at least one of the indicators, then the group will get a score.
To get the day's news and headlines in your inbox each morning, sign up for our email newsletters.
A significantly larger amount of "Insufficient" grades have been given to non-white student subgroups.
Seven schools in CHCCS had an insufficient grade given to their Hispanic subgroup, but out of those seven schools, six of them had a student population above 30. Similarly, for Asian and Black populations, at least half of the schools that were given an "Insufficient" grade had demographic populations above 30.
For example, there was insufficient data for the Black student population at Carrboro High School despite there being 66 Black students in 2022.
Of the 18 schools that reported subgroup letter grades in CHCCS, no school had an incomplete grade for their white student subgroup.
"If there is not enough data for all indicators, then the student group does not get a score," Sonneman said in an email. "If the student group has at least one academic indicator that meets the minimum requirements, then the student group will get a score."
Trice said he believes these disparities represent historical trends prior to the COVID-19 pandemic. He said there are many reasons why students from minority communities are often caught up in these patterns, including access to resources as Sartain said.
Achievements
On a larger scale, the district saw some improvements in growth and performance.
The data showed that 100 percent of schools in CHCCS met or exceeded their growth expectations.
CHCCS also saw a 94.5 percent graduation rate — the highest ever recorded in the district’s history. It increased from 92.8 percent, which was recorded during the previous year. In comparison, the statewide graduation rate was 86.2 percent, down 0.8 percent from the previous year.
Trice said he believes these improvements make a statement about the importance of in-person learning.
He said he attributes the growth to students being back in a communal space and teachers having a more direct link to observing students' understanding of the material. Teachers can also address concerns in real-time, he said.
“It doesn't surprise me that students are rebounding," Trice said. "We fully expect that that trend will continue."
Future of equity in CHCCS
Trice said CHCCS is taking steps to ensure that students are engaged in the highest possible level of content rigor and feel respected and affirmed through culturally responsive instruction.
George Griffin, a member of the CHCCS Board of Education, said through CHCCS’s Strategic Plan for 2022 to 2027, the district aims to take a holistic look at students’ emotional and mental well-being in addition to test scores to see what needs to be adjusted in order to mitigate educational disparities.
“We are looking at their instructional program, but more specifically looking at it through a racial equity lens,” he said. “And then even more specifically, is it the curriculum itself that we need to adjust or is it our teaching methods? Or just exactly what is it that's not getting us the results we want for all 100 percent of our students?”
Sonneman said NCDPI has already started collecting data from the 2022 to 2023 school year.
Griffin said he thinks CHCCS will demonstrate increasingly positive results over the 2022 to 2023 school year based on positive staff responses to district leadership.
Trice said racial disparities in school performance extend beyond the school system and into areas like healthcare, higher education, wealth and employment that must be addressed by the community at large.
@averysnotabaker
@DTHCityState | city@dailytarheel.com